


Making the most of your data
Ever-expanding datasets require more resources to use the data to its full potential. Our data analytics modules help manage your data by presenting large and complex datasets in a flexible range of user-friendly formats. Whether your data is consolidated by our DataHub system or your own aggregation software, our data analytics options help you to access and analyse the information you need.

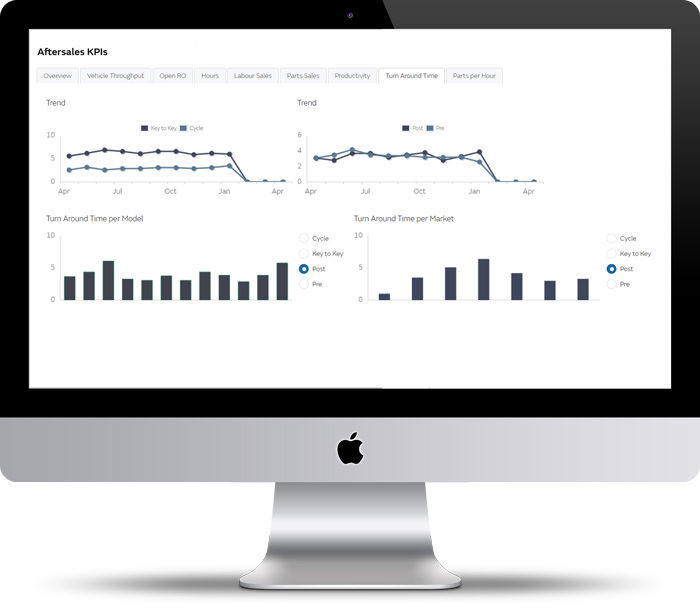
KPI Analyser
Improve business performance with our customised KPI Analyser module. Identify and rectify critical performance issues and increase efficiencies via our easy-to-use interface.
The KPI Analyser’s dashboard takes your consolidated data and presents it as simple visual representations of your KPIs. Monitor your sites, outlets, departments or more using a wide choice of graphs, maps and tables. Compare actual performance with targets or against other parts of the organisation.
Go wide or go detailed.
Drill down as far as individual outlets. Drill up to give a company-wide overview. See your KPIs at all levels.
Easy-to-use.
Clear graphics and menus make the dashboard accessible to any user, enabling everyone in your team to analyse the data they want without input from the IT department.
Bespoke design.
Our consultants can alter the baseline dashboard to present the data in the way that suits your organisation best.
Quality Checker
How well do your outlets or locations gather and process their data? Our lightweight Quality Checker helps you improve your data by providing a clear picture of its quality. The Quality Checker dashboard enables you to see, down to the level of individual locations, the validity of each type of data collected. Identify where the gaps lie and where issues need to be addressed.
Clear results.
See right away which region, location or outlet has quality issues, and identify the data gaps.
Implementable actions.
Improve your data by sending daily, weekly or monthly reports to data quality offenders.
Simple interface.
The Quality Checker’s drag-and-drop menus and clear graphs make the dashboard quick and easy to use.
Highly customisable.
Choose the exact data quality rules that meet your business requirements, and we’ll create a bespoke dashboard for you. And the Quality Checker’s flexiblity means that you can use it as a stand-alone module, or link it with our other analytics modules.
Data Visualiser
Our Data Visualiser puts you in control of your data from the start. The module contains a dashboard that presents your data as actionable graphics, which can then be shared throughout your organisation. Visually analyse any of your data using customised reports and dashboards. The interface is easy to use, so that you can sort, filter and display your data without having to continuously rely on your IT department for customisations.
Flexible design.
Our bespoke approach means that we can flex the Data Visualiser to suit your organisation’s particular needs. No more trying to work around out-of-the-box software.
Visually appealing interface.
Modern and harmonious, our dashboard provides a user-friendly experience.
Shareable across your organisation.
Develop reports together with your colleagues and share with each other for better decision making.
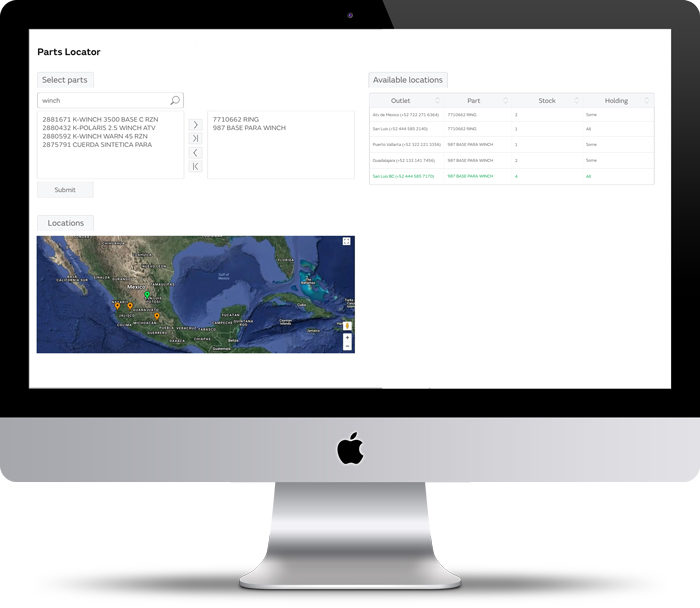
Stock Analyser
Maximise profitability by balancing inventory levels using our Stock Analyser. Reduce the financial drain of unwanted inventory and minimise out-of-stocks by using the dashboard to assess stock levels across the organisation or by individual location.
Closer co-operation.
Enable outlets in remote geographies to operate more closely and reduce delays by sharing parts.
Stock location option.
Easily find spare parts or units with the dashboard’s stock location option. Identify the nearest locations of available items using the Stock Analyser’s mapping system.
Flexible parameters.
Analyse everything from individual parts to overall stock levels, cutting the data by site or outlet. You can even analyse the costs of and revenue generated by your inventory.
Useful units.
Assess your organisation’s inventory by volume or value, and switch between different time periods according to your organisation’s deadlines or accounting periods.
Predictive analytics options
Our data analytics services all have add-on, predictive options to help your organisation forecast events accurately. These modules reduce service or stock unavailability and run your assets at optimum performance. Boost productivity and reduce costs, and benefit from the ability to create your own alerts.
Simply choose the most suitable options for your organisation.
Identify stock or parts shortages before they occur.
Many organisations and supply chains aim to achieve high customer service levels while operating efficiently with low inventory. Adding predictive analytics to your dashboard enables you to monitor inventory levels and will alert you if levels become too low.
Plan for busy periods.
Our dashboards can be tailored to predict when peak times will occur. Receive alerts to identify when more staff or extra inventory will be needed, and where.